
May 13, 2016
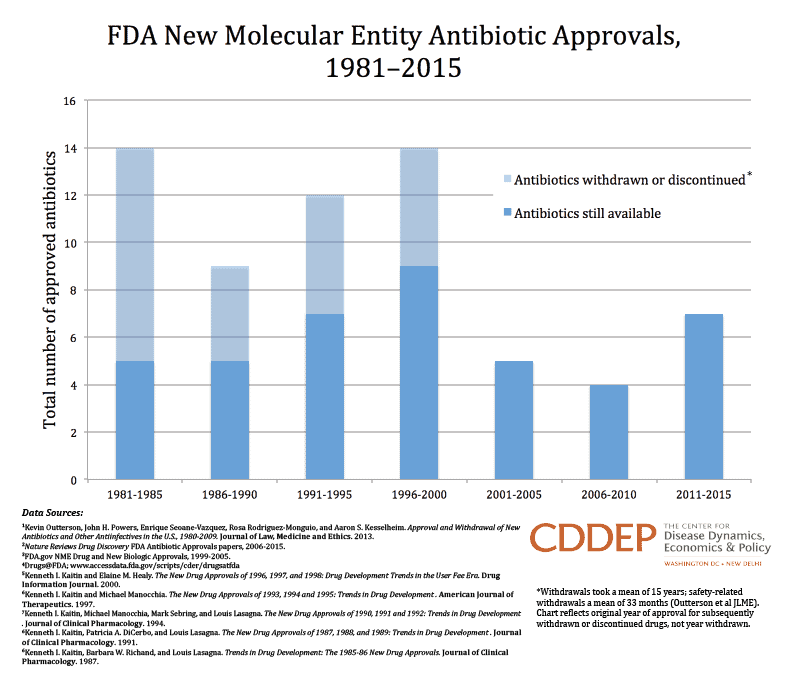
This graphic presents an updated and corrected version of an often-plotted chart of FDA antibiotic approvals of the last few decades, and differentiates antibiotics still marketed from antibiotics that were later withdrawn from the market for safety or business reasons. The chart does not purport to reflect the extent to which these agents address unmet medical needs for antibiotics that are active against specific bacteria. Watch this space for graphics under development that unpack the elements of this issue.
Right click here and choose “Save As” to view or download this graphic.
Adapted from Outterson et al, JLME 2013.


