October 23, 2014
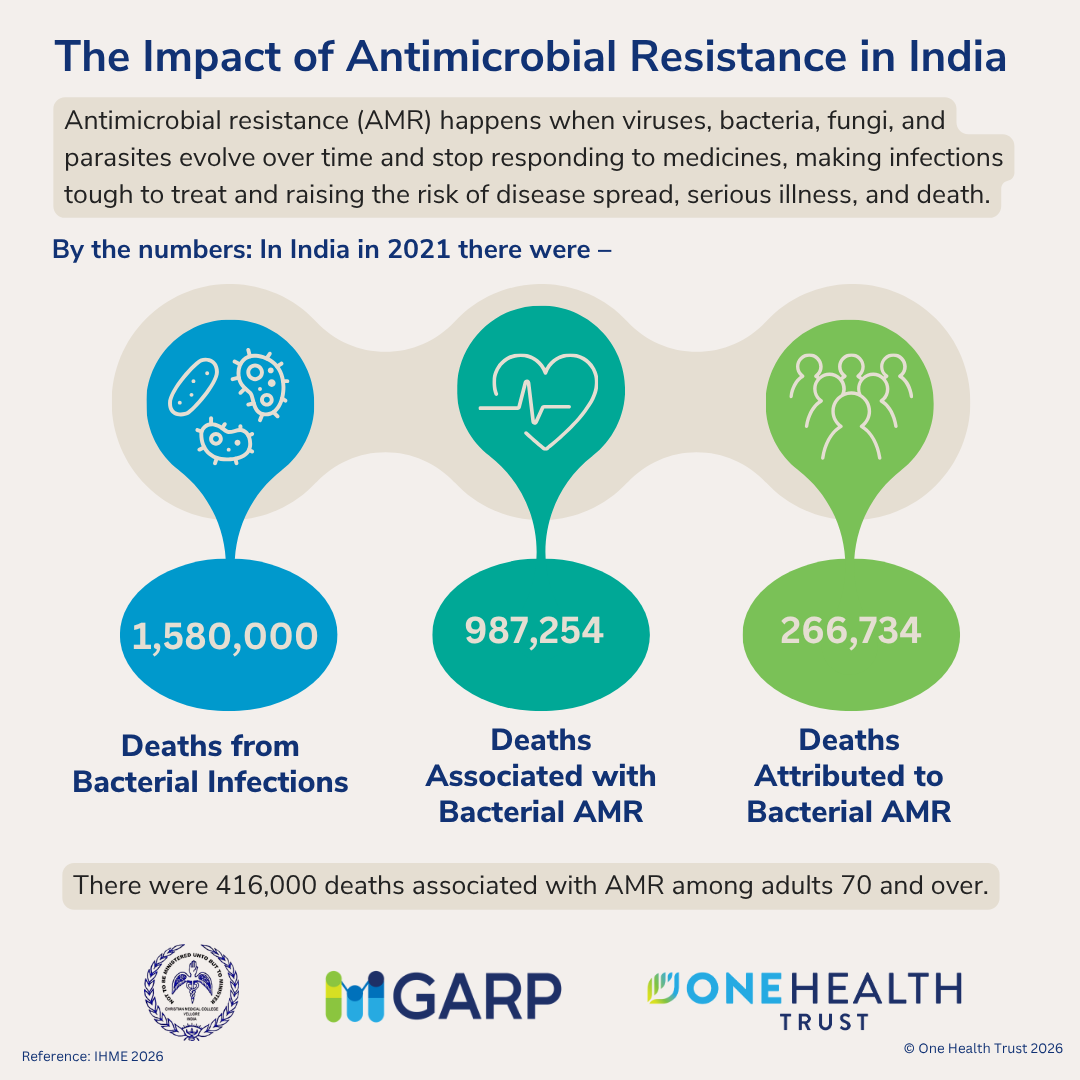
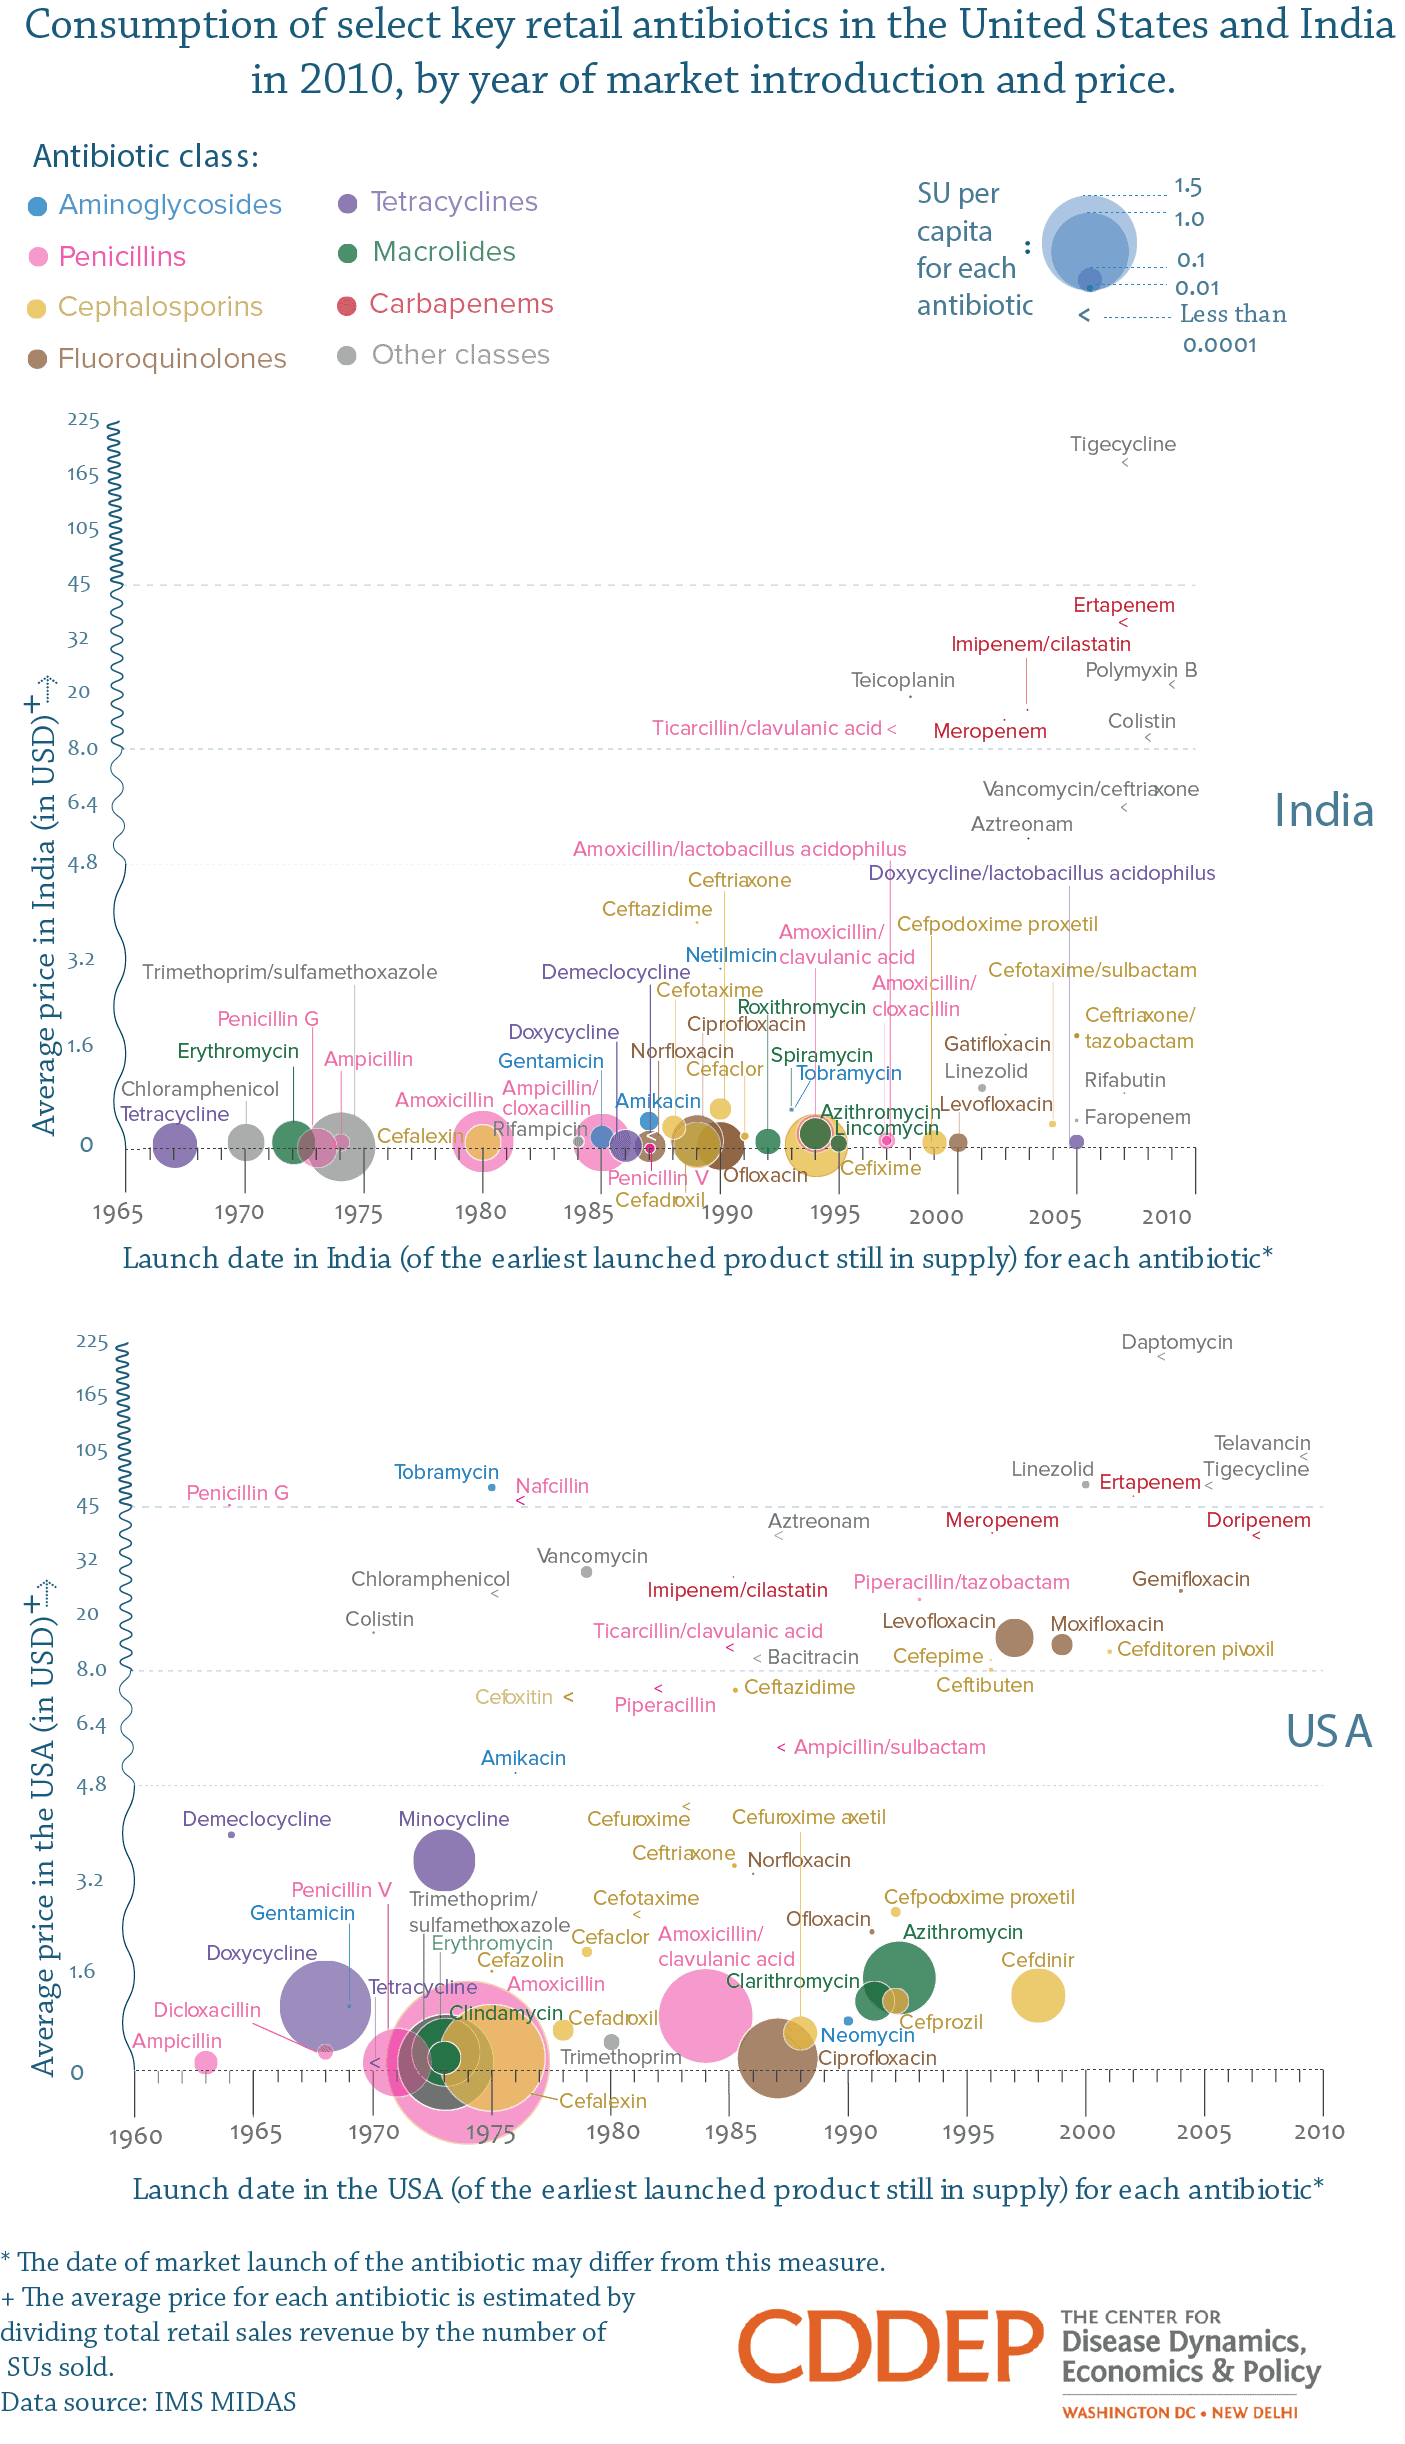
Ever since antibiotics were made widely accessible by mass production in the 1940’s, their use has increased significantly each decade. However, along with this increase in use, antibiotic effectiveness has also declined. A recent study done by CDDEP showed that global sales of antibiotics for human consumption increased 36% between 2000 and 2011, with Brazil, Russia, India, China, and South Africa accounting for 76% of the increase. In 2010, India had the highest consumption of antibiotics with 12.9×10^9 units (an estimated 17.5% of global antibiotic consumption in 2010), while the US had the third highest consumption of antibiotics with 6.8*10^9 units (an estimated 9.2% of global consumption in 2010).
By plotting antibiotic use and prices in 2010 and the dates of market launch for each antibiotic, this graphic shows that newer antibiotics tend to be more expensive and used less frequently. Using data in the IMS MIDAS dataset, we estimate the average unit price for each antibiotic in each of the two countries by dividing total revenue by the total quantity of antibiotics sold. We also use the same dataset to find the date of market launch of the earliest launched product for each antibiotic. Since this dataset includes only those antibiotic products that are currently sold, this measure may not provide the actual date of market launch of the antibiotic, especially for older antibiotics. We also include only those antibiotics for which sales data, revenue data, and the launch dates are reported.
This graphic was published in a recent paper by CDDEP Director Ramanan Laxminarayan in Science.