
November 01, 2012
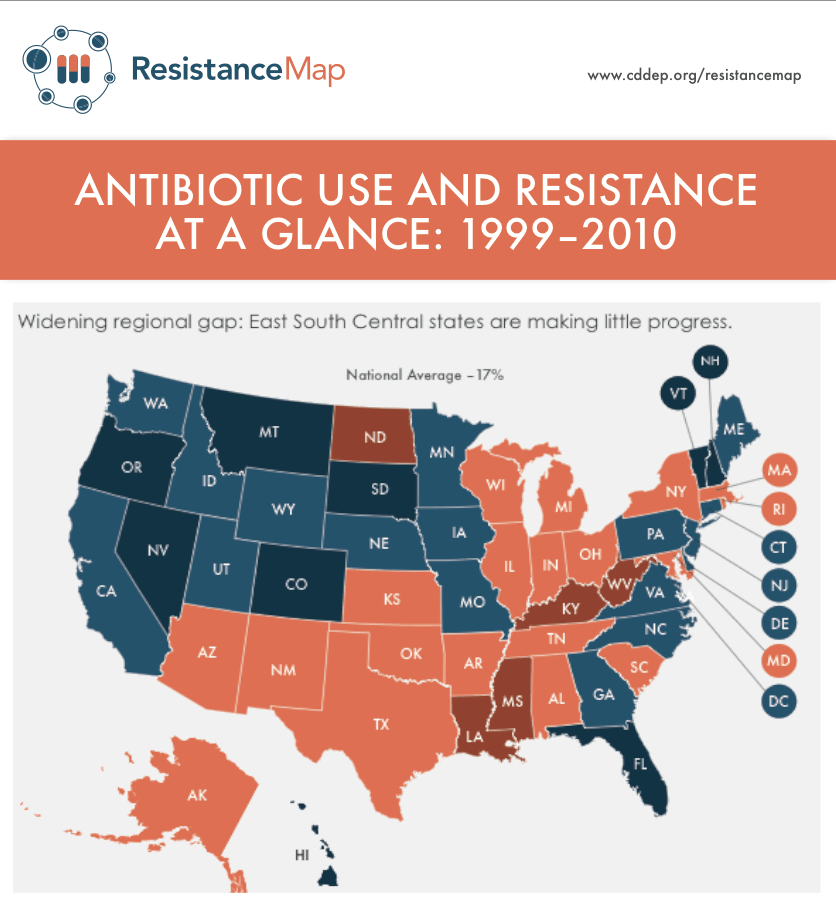
The infographic summarizes our latest findings from the interactive ResistanceMap visualizations on the alarming trends in drug resistance and regional use of antibiotics between 1999 and 2010.
Download print materials here:
Key takeaways:
- Since 1999, the percentage of antibiotic prescriptions filled nationwide has dropped by 17%. However, high-consumption states are lagging in this positive trend and are seeing the smallest decrease in prescriptions, resulting in a widening use gap. Researchers found staggering geographic variation residents of Appalachian and Gulf Coast states, where antibiotic use rates are highest, take about twice as many antibiotics per capita as people living in Western states.
- In 2010, the five states with the highest rates of antibiotic use in the nation were Kentucky, West Virginia, Tennessee, Mississippi, and Louisiana. The maps show higher-than-average use of antibiotics in other regions of the country, as well.
- In 2010, the five states with the lowest antibiotic use in the nation were Alaska, Hawaii, California, Oregon, Washington and Colorado. Other Western and New England states also showed lower-than-average use.
- National use of fluoroquinolones an antibiotic class commonly used to treat respiratory infections such as pneumonia increased between 2000 to 2007, but fell by 24 percent from 2007 to 2010. This significant decrease could be due to a black box warning the Food and Drug Administration placed on levaquin, a type of fluoroquinolone which had serious side effects.
- The Drug Resistance Index combines the extent of their use with data on their ability to treat organisms that cause infections. The results fro two common infections show that the available arsenal of drugs used to treat UTIs are losing their overall effectiveness, with the overall share of resistant bacteria increasing by over 30% between 1999 and 2010.
See how your state s antibiotic use compares at ResistanceMap.
NOTE: A version of Graph 1 initially published on November 13, 2012 mistakenly abbreviated Arkansas as “AK”. A corrected version of the graphic was uploaded on November 16th.


