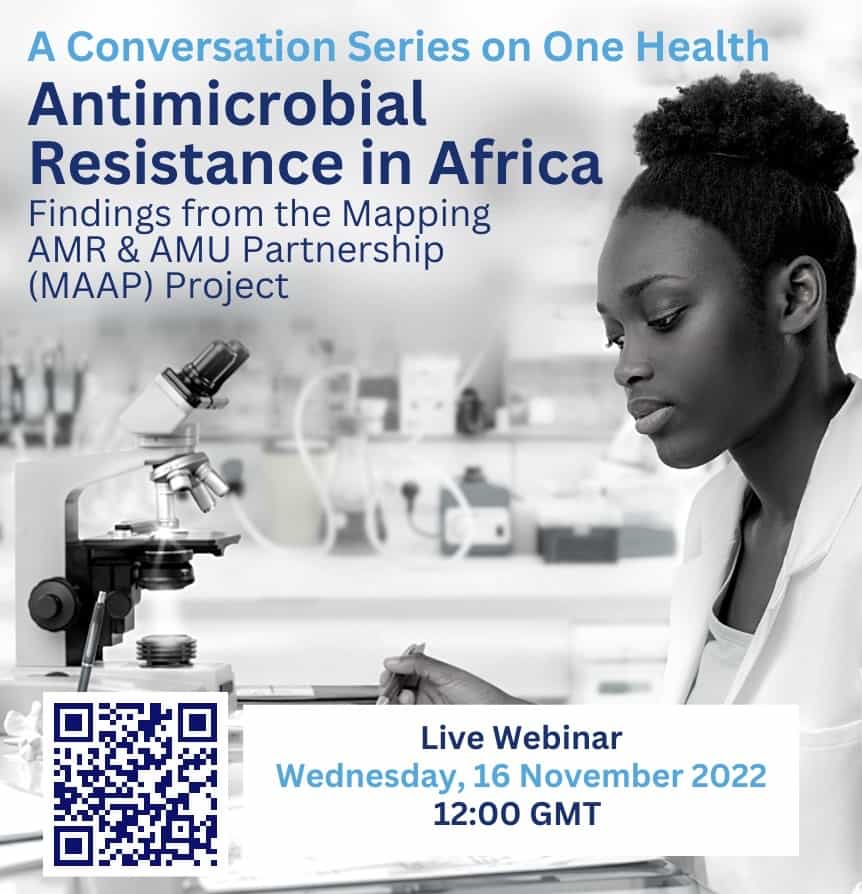
In the second webinar in our Conversation Series on One Health, learn about the Mapping AMR & AMU Partnership (MAAP) project, which collected and reviewed AMR records from 205 laboratories across 14 African countries, providing a unique regional perspective on AMR burden and AMR surveillance capacities.
Find out more about these important findings and how they can contribute to shaping strategies to tackle the growing threat of AMR in Africa.
You can also view a recording of this webinar here.
Erta Kalanxhi
Hi, I think we’re live. Okay, that’s great. So, hello everyone. Welcome to our conversation series on One Health. My name is Erta Kalanxhi and I am thrilled to moderate this discussion today.
At One Health Trust we are committed to bringing awareness to antimicrobial resistance and as we approach Antimicrobial Resistance Awareness Week, we are very excited to have with us colleagues and partners from the MAAP consortium to bring awareness to antimicrobial resistance in Africa. The Mapping of Antimicrobial Resistance and Use Partnership project, or MAAP, was a huge undertaking that was led by the African Society for Laboratory Medicine and its success is a result of pure dedication from all the partners involved, and the 14 countries that share the data in order to bring light to this burden in Africa. Everyone working in the AMR space understands the challenge of developing policies that are country-specific, but based on data that comes from a global scale. In this context, the MAAP project has provided a unique insight into some of the challenges as well as the extent of AMR burden in the region.
Our speakers today will talk about this project, share some of the findings, and what they actually mean for future AMR strategies. At the end of the session, you will have the opportunity to ask some questions directly, so feel free to add them to the Q&A section. I am truly honored today to introduce our speakers, whom you may already know from their contribution to this cause.
So Dr. Yewande Alimi from Africa Centers for Disease Control and Prevention, Edwin Shumba from the African Society for Laboratory Medicine, and Dr. Geetanjali Kapoor from One Health Trust. I will start with Edwin Shumba, who is the AMR Program Manager at the African Society for Laboratory Medicine, and has been instrumental in coordinating the activities for the MAAP consortium. Edwin, thank you so much for taking the time to join us today. I know that everybody in this group has a very busy schedule with AMR Awareness Week coming up.
Could you please give our broader audience an introduction to the MAAP consortium, how it came about, and perhaps talk about some of the major findings with regards to AMR surveillance capacities in Africa?
Edwin Shumba
Thank you very much Erta. As Erta indicated, my name is Edwin Shumba, I work with the African Society for Lab Medicine and it is a pleasure to be sharing with you today just a quick overview of what the MAAP project is all about as well as sharing some results on the status of the AMR Laboratory Network in 14 countries of Africa.
This is a journey that we took for 36 months and I will try to summarize all that work in the next 10 minutes. So this work was funded by the Fleming Fund. As Erta indicated, this was an ASLM-led consortium called the MAAP consortium, which had some strategic partners: the Africa CDC, where one of our speakers comes from, we had ECSA as well as WAHO, who really were giving us that support in terms of the traction that we needed in terms of engaging the countries. We also had some technical partners, so One Health Trust, which was looking at the AMR data which my colleague Geeta will really speak to, as well as IQVIA, who looked at the AMC component of the data, as well as InSTEDD, who were our technology partners who developed the tools that we’re using for the data collection as well as storage.
So taking us through the MAAP, we had a problem when we started back in 2019, when we said look, in Africa, there is scarce data for large-scale analysis. That was something that we knew. But in terms of why we didn’t have this data, whether that data was not being generated or it was not being reported, it’s something that we didn’t know, and we sought to explore in this work that we were doing in the MAAP project.
Also, we knew that there was some data within the countries, but that data had not been exploited. What we didn’t know at that time was that, is it because the data was inaccessible, or it was the format in which the data was being stored or some other reason? So the objective of the MAAP consortium was then to collect that retrospective data, digitize the data that we found in a paper format, as well as then perform some analysis for both AMR and AMC with three key buckets of outcomes. The first bucket being around understanding the AMR lab networks within these countries, so we wanted to measure what we call the surveillance readiness for AMR testing, as well as try to answer that question around the gaps in data generation and reporting.
The second bucket was mainly focusing on the AMR, which is establishing the baseline prevalence as well as trends for AMR in these 14 countries, understanding the drivers as well as calculating a drug resistance index. The last bucket was around the AMC, where we then sought to understand the data surveillance visibility as well as challenges around collecting the AMC data, as well as quantify and evaluate the trends for the consumption of antibiotics across these countries. So I’m going to be focusing on the first bucket which is the lab networks as Erta indicated.
First, you have functional AMR networks that produce reliable data as well as reporting representative and quality data. There are three things that we need to have in this matrix. The first is around capability, we must have laboratories that are able to perform AMR testing, as well as have the capability to be able to report the AMR result. The second component is the population coverage, we should then be able to cover greater than 80% of the population for us to say our network is functioning pretty well. And then the last component is around quality, we then want to make sure that the data that is coming out of these labs is following some quality standards and the labs are implementing some quality management systems.
So in the work that we were doing, we then had to, first of all, understand how big these laboratory networks were in the 14 countries where we’re collecting data. So our endpoint was then the AMR coordinating committees, which are the AMRCC, so with the leadership of our strategic partners – ECSA, WAHO, as well as Africa CDC – we’re able to engage these countries to better understand these lab networks as well as a plan for the subsequent data collection and analysis that we’re going to do. So the first thing being that data is the new gold now, we had to establish data-sharing agreements with the countries. So we are glad that we managed to establish those data-sharing agreements between ASLM and the countries.
After that, we were then able to inventory the labs that are within these countries. And as you can see from that table, we eventually found that there were about 50,000 laboratories within those 14 countries. And interestingly, we had quite a lot of laboratories, like Nigeria 34,000, Tanzania more than 6000, but the bulk of the laboratories of the countries had laboratories in the 1000 range and there are a few countries that have very few labs, like Gabon and Eswatini.
So how did we then go about it, coming from those 50,000 laboratories? We then had to engage our AMRCCs in the countries, we developed a questionnaire to be able now to assess the quality and capacity of these labs. For us, the interest to understand those gaps in calculated surveillance, to be able then also to see whether it’s because of lower reporting or lower testing. Thereafter, we then had to select laboratories due to budget limitations where we wanted them to be able to collect data from a minimum of 16 laboratories in each of these countries.
Our questionnaire, which helped us estimate AMR surveillance readiness, had six components looking around – the commodities and equipment, QMS and accreditation, the quality standardization of the AST execution, human resources, specimen management as well as information. We then calculated that all to then get what we termed a percent of AMR readiness. So this just basically shows how we float from those 50,000 labs. As you can see, we ended up focusing on 393 laboratories that then completed the questionnaire that we shared with them, and we also collected some GIS data. We then distilled based on the eligibility questionnaire to 205 laboratories where we then collected data for this study.
As you can see from this pyramid, we had about 70 laboratories sitting at the top, which were mainly our reference laboratories, and the bulk of our laboratories were within the intermediate district levels, and just a few sitting at the bottom of the tiered network. What we then found is that 80% of the laboratories performed less than 1000 AST tests in 2018, which then gave us an answer to one of the questions that we had at the beginning – is it because data is not being generated or it’s not being reported? So we realized from just this, that first of all, this is an issue of low testing across these 14 countries. We also then found during this week that there is a decreasing capacity as we go down the levels. As you can see from that chart, you see that the QMS activities, certification, accreditation, authentication, participation in EQA until you get down to compliance with the susceptibility testing standards, whether the CLSI or EUCAST were decreasing, as you came from the reference laboratories which had a higher capacity. So we then found out that these poor capacities at the lower levels, which then obviously undermined AMR surveillance, as we saw from the number of labs that are sitting with those lower tiers. There is a need for us then to be able to build mechanisms that help capacity at subnational level laboratories so that they’re able to contribute to AMR surveillance.
We went on to look at some of the geographical coverage across these countries. So for the 16 laboratories that we then had to do inventory, we tried to calculate a catchment area that one has to drive approximately an hour before they reach the facility, where they can get AST testing. So you can see from this that there is quite a low population coverage for about seven of these countries, which are below 50%, the laboratories in Nigeria, Burkina Faso, Cameroon, Chile, until you get to Sierra Leone.
We also went on to say let’s look at some of the work that is already going on in terms of policy as well as strategic planning to see how it is informing AMR control. What we saw is that lab issues are not sufficiently addressed in the national action plans. If you look at this graph that’s showing, you find that less than 10 interventions are laboratory specific when you then compare with the other interventions that are within the NAPs for the different countries. So we really need to start thinking around, how to increase the coverage as well as the capacity of bacteriology testing laboratories, since we have less than 10% of interventions focusing on the laboratories. So I think as we get into Antimicrobial Awareness Week, we want to start thinking around how we review our NAPs to be able to have more interventions that are targeting laboratories, so that they’re able to generate enough data for surveillance.
In summary, what we saw is that when we started with those 50,000 laboratories across the 14 countries, we found out that 1.3% of laboratories were actually performing bacteriology testing at that time, which is 2016 to 2019, which is quite low. We need to start thinking about how do we then increase this 1.3% to maybe 50%, where we have half of the laboratories within the country performing AMR testing. For this survey, 44% of [laboratories] were using paper-based systems, so we need then to digitize and have electronic systems within our microbiology laboratories. 80% of the labs performed less than 1000 tests per year, which is low and very few labs can be accredited.
So what is our take-home message for all this work that we did in the 36 months? Lesson number one is that very few labs in the national laboratory networks are actually conducting bacteriology testing, so there is no equitable distribution of bacteriology testing in the countries. So as policymakers, we now need to start thinking, how do we ensure that bacteriology testing is equitable?
The second – the volume of testing is very low, so that is a consequence when the representativeness of the surveillance data that we are looking at within the countries as well as the access to bacteriology testing, so access is a keyword, we need to increase access to bacteriology testing. Thirdly, you’ll find that most of these laboratories do not participate in EQA and most of them use paper-based systems. That has a consequence, obviously, on the reliability of the results that are coming from these labs, so we need to ensure that more and more labs participate in the EQA and they also update the LIS systems that they’re using.
That higher AMR testing capacity that we saw at the reference level needs to trickle down now to the lower tiers. And then lastly, our national action plans do not sufficiently address our lab-strengthening initiatives, and that is a homework for all of us. So with that, I want to thank the participating countries, the Ministries of Health, the AMRCCs that really worked nicely with us in the 36 months, as well as our partners, our PI Dr. Pascal Ondoa, as well as Anja who really supported us throughout this work, and a special thanks goes to our funders for the support that we have. So with that, colleagues, I want to thank you.
Erta Kalanxhi
Thank you Edwin for this very good presentation. I think the visuals and the graphs you presented told a very interesting story. I think the problem with AMR surveillance capacity is not limited to African countries, it’s a problem that is at large, but it is an amazing initiative to actually provide actual evidence on where the bottlenecks or the gaps are in order to address them. So with saying that, I’d like to ask the next set of questions to Dr. Geetanjali Kapoor from One Health Trust.
Geeta, thank you very much for joining today. Geeta is the Director of the India office at One Health Trust and she has led the AMR data analysis package and has some additional insights to present to us today. So, Geeta, the audience is really curious to know some more insights into the AMR burden and perhaps some potential drivers that may be driving this resistance in the countries that you surveyed. Over to you.
Geetanjali Kapoor
Thank you Erta, let me share my screen. Alright, so we will not go over what has already been mentioned by my colleague Edwin, we’ll go straight to the main findings. So we all know this project was called the MAAP, which is an acronym for Mapping AMR and AMU Partnership, and the focus of my presentation is basically going to be around the antimicrobial resistance component, the first A of the MAAP, that’s going to be the focus of my presentation on behalf of the One Health Trust.
I think all of us know that One Health Trust was previously called CDDEP, and this slide has already been shown before by Edwin which talks about our funders on the left-hand side and on the right-hand side you can see all the different partners including African Society for Lab Medicine, as well as the other partners. So these objectives were also mentioned by Edwin and as I mentioned, I will be basically focusing on the middle part, you can see the red box here on the antimicrobial resistance-related outcomes. So we basically had three different objectives or outcomes, which we were interested in in this study. We were keen to look into baseline AMR prevalence and trends, the drivers of AMR, or maybe let’s say the potential drivers of AMRm, and a very interesting indicator called the drug resistance index, so I’ll go into all these three.
Now on this slide, first of all is where Edwin stopped last, as he mentioned that 205 labs were selected for data collection across the 14 countries in Africa. So let us look into what kind of contribution we got from the different countries. So on the left-hand side, you can see we have 14 countries, you would say they are ordered in a very random way, well, it’s not like that. The first six are basically from the Western Central, arranged alphabetically, the next three Kenya, Tanzania, Uganda are from the east, and the last four are from Southern Africa. And that’s how we will be showing across in all the graphs.
So we had the maximum contributing labs were from Nigeria, we had about 25 labs from that country and from the rest we had about 16. So in the beginning, we thought that we will take the 16 labs from each country, and that’s what basically happened but from very small-sized countries, like Eswatini and Sierra Leone, we had a lesser number of labs contributing which is also logical. And on the right-hand side, what we are showing is how many actual cultures were collected in the field in each of these countries. As you can see, we were very close to about 1 million culture results in all and close to a quarter of those 1 million cultures were positive cultures with AST results, which I think most of the lab professionals we know that about 20 to 25% of cultures normally tested turn out to be positive, so we came somewhere close to that also.
And again, the contribution number of cultures which came from each country also was varied. From some countries like Cameroon, we had a lot of cultures, results came from a lot of cultures, and from smaller labs like Sierra Leone, a lesser number of cultures were also available for further analysis. Over here we are trying to show what exactly when we say that we were close to 1 million cultures in this circle, so precisely it was about 819,000 cultures total, and about 60% of those cultures were invalid or they were negative, or there was not much really to do with those, they were filtered out, we could not take it for analysis. But if you look into this green colored segment, that’s telling what was of interest to us, so that was about 23% of these total cultures which were positive and it had the AST results.
Now I’m going back to the bigger umbrella, that was when we were close to about a million cultures, 819,000 cultures. The contribution which came from the different labs was varied and again, we had a maximum number of cultures which came from Cameroon, and very little came from smaller countries like Sierra [Leone], Gabon and Eswatini. And again, if you look into the distribution in each of these circles, for example, if I pick Cameroon, then you can see that we had more than 60% for negative and we had about 20% which were positive cultures with AST results. It was a similar story in most of the countries.
Now I’m going to the segment of interest, which is about 0.18 million cultures which were positive with AST results. This is what this slide is showing. And we have shown individually for each of the countries in this particular graph on the left, and on the right, it’s a collation from all the countries and what we see is most of these positive cultures, what kinds of samples gave positive growth – it basically came from urine samples and blood. So on the right-hand side, what you can see is, and we have the legends over here, so these were the three [common sources], and in the laboratories we know these are the most commonly cultured and also the most common samples which turn out to be positive. So that’s what the distribution was like.
Coming to what kind of pathogens were isolated from these positive cultures, again, let’s focus on the circle on the right – on the left, of course, it’s country wise, and I don’t think we’ll have that kind of time right now to go through each country – if you look into the composite picture, we had a lot, in fact, most of our positive cultures, the pathogen that was isolated was, if you see that blue color, it was Staph aureus mostly, and then of course we had enterobacteriales, that was E. coli and Klebsiella, and the rest of it, we have colored in in this gray color. So these were the three most commonly isolated pathogens from the cultures which were positive.
We also looked into the lab’s data quality and the country’s data quality through a very objective methodology and it ranges from zero to four. As you can see on the left hand side, you’ll see every country has a number at the end and most of the countries had a reasonably good data quality score at the country level, zero indicated the low scoring and four indicated a high scoring, so it was basically one to four. The smaller countries, they had the data quality on the lower side of course, there were reasons we did not go into all that because this was not an exploratory study, that can be considered maybe at a later point of time, but it was interesting to know that reasonably most of the countries did produce data of good quality. And what did we do basically with that 0.18 million positive cultures? We looked into the AMR rates, what were the resistance rates for different kinds of pathogens? We followed a well defined methodology as per the CLSI M39A4, and the confidence interval was also estimated for the AMR rates through a Wilson cluster robust method which was actually done by Dr. Erta [Kalanxhi] and Dr. Elli Klien. They had in fact also authored a paper on this, based on this particular study.
We looked into the AMR rates for, the primary objective was to look for the bacterial priority pathogens, the BPPL, and we covered all these 14 different pathogens. But when we analyzed it, what we saw is that the countries did not have enough data and for most countries, the rates could be estimated for only five of these 15 combinations, and these have been highlighted in blue. Now in the next few slides, I will be going into what kind of resistance we saw for these five pathogens.
Now we begin with the first one, which was a critical pathogen as per the WHO, the carbapenem-resistant Pseudomonas aeruginosa, and as I have mentioned on the left-hand side, we are showing the country-wise picture. Why do we have these four different rectangles? Every rectangle signifies the year, so 2016 right on the top, 2017 in the middle, 2018, and for some countries we also have data from 2019. Primarily, this was a historical study as Edwin had mentioned, so all the data that came to us for analysis was from previously collected results.
What we saw is that overall the resistance rate for this group of pathogen hovered around 25 to 40% in most of the countries, so in 8 out of 14, we saw it was in this range, and specifically, of course, each of the countries has been provided with the country report and details can be looked into, but this is pretty high considering that this is a very important nosocomial pathogen. It has a lot of implications on the clinical side, we know these infections are fatal, and we also know that Pseudomonas aeruginosa will get carbapenem-resistant if it is exposed a lot to this particular antibiotic. And when does this happen? This happens of course, when there’s a prolonged antibiotic usage or extended stay in the hospital, patient is on a device for a long time, he has some underlying comorbidities, especially cystic fibrosis and respiratory patients, patients with burns, et cetera.
So, how do we kind of control this, which I will be showing on the next slide, is that it’s not rocket science, we all know that these infections can be mitigated, they can be contained if very basic prevention and containment measures are followed. Not specifically for just this bacteria, but across all the different bacteria which I’ll be talking about. Simple standard precautions of hand hygiene, not putting the catheter for beyond the stipulated time, early device removal, and of course in the hospital also following the stewardship practices and infection control programs need to be really well implemented.
This was about the first critical pathogen, then coming to the other one, we also saw that the rates were high for the carbapenem-resistant Enterobacterales. It was around less than 25% but still, for some countries, like for Ghana, you can see the bar goes really high, but overall in the rest of the countries, most of the countries, that was less than 25%, but yes, it can always be on the higher side – this is historical data, so it has a scope of increasing if it is not contained on time. The implications are pretty much similar as for Pseudomonas aeruginosa. Of course, the kinds of patients which normally get infected with this are not the same as it happens for Pseudomonas infections, not really for burn patients, not really for patients with cystic fibrosis, we know that, but overall yes for patients who are in the hospital for too long, they are catheterized ,or they are on any device, they could be transplant patients, or patients with any underlying comorbidities.
Where do we and how do we mitigate these infections? And the principles remain the same, the principles go by, again your standard precautions and contact precautions, including hand hygiene and training the nursing staff about washing hands from one patient to the other and I think that could also be emphasized in World Antibiotic Awareness Week. Compliance to infection prevention practices is, again, a very simple measure that needs to be adopted but it has ramifying effects when it’s not implemented, and stewardship practices, and seeing to it that the antimicrobials are prescribed only as and when needed and tailored immediately when you have results from the lab and a diagnosis is there.
We also looked into the rates for the third generation cephalosporin-resistant Enterobacterales, very high, more than 50% in most of the countries, you can see the orange bar going really high for all the 14 countries and for Sierra Leone we did not have, you’ll see a blank over here, so we did not have data for Sierra Leone, but for the rest of the countries we had the data and it was typically above the 50% bar. It’s mostly going above 50% in most of the countries for all the three years. Again, it’s a cause of concern and it just shows that if you don’t take measures today, it’s going to be a bad pandemic or a bad tsunami in the future, in fact in the very near future.
The other fourth pathogen from the WHO group for which we got the high AMR rates was MRSA, more than 40% in most of the countries, and we know MRSA is causing not just community-acquired but also nosocomial infections. It’s causing not just skin and soft tissue infections, though Staph does stay on the skin, but it also causes other invasive infections like endocarditis and pneumonias, abscesses, shunt infections, etc. and risk factors are again there. Why do you catch MRSA? We know it could be because a patient is already colonized and he was perhaps not de-colonized for his procedure, he was already exposed to methicillin group of drugs, it could be post-surgical state, dialysis patients, et cetera.
So, where and how do we mitigate this infection? And again, the principles pretty much remain the same, but in addition to MRSA, what we can add is that the high-risk patients are the patients who are going for any kind of surgery, especially device insertion, their preoperative tests and screening is very important and if they are already harboring MRSA, they need to be decolonized. This was interesting to find that we need to do a lot if we need to prevent these infections from expanding in the future.
The last bug from the WHO list for which we got the high AMR rates was fluoroquinolone-resistant Salmonella species, it was more than 25% in about four to five countries, not all, we did not get data for this pathogen from most of the countries, but we got some from 5 out of the 14 countries. We know salmonella does cause enteric fever, iIt also causes various other infections, especially the non-typhoidal strains. So considering all these things and looking into the risk factors for harboring these infections, such as schistosomiasis, immunocompromised state, extremes of age, malaria, chronic liver disease – these are the kinds of patients who usually come up with this infection and of course overexposure to fluoroquinolones today has made this a global concern because this is one of the last resort drugs – fluoroquinolone, macrolides, and cephalosporin, which we were resorting to, but mostly all these three are now showing up with very high resistance.
So what do we do in this particular combination? We need to immediately take action. Food and water safety has to be stepped up, we need to screen the food handlers for chronic carrier state, vaccinations need to be given, especially we know typhoid vaccines exist, so they have to be given for prevention. And the use of antibiotics has to be restricted, not just in hospitals, but also on the animal husbandry side. Patients need to be told about the importance of completing their antibiotics so the infection can be eradicated and there is a lower chance of any relapse.
We also looked into two more objectives, we looked into the drivers of resistance and the drug resistance index. So I hope we have the time, Erta do we have the time to go over this?
Erta Kalanxhi
Perhaps briefly, Geeta. We have five more minutes.
Geetanjali Kapoor
All right, so I’ll just round it up quickly. We looked into the AMR drivers which were done at two levels, the patient level and the country level. At the patient level, we looked into the patient demographics – age, gender, diagnosis, comorbidities, it’s there on the left-hand side, and mostly we applied a multiple logistic regression to see if any particular age is predisposed to resistant infections. Every country had a very different scenario, but if you look into Burkina Faso, right on the top, you’ll see that patients who were elderly, more than 50 years of age, they were 1.3 times more likely to harbor or to acquire resistant infections as compared to patients younger than that.
And likewise, every country was different. We also saw in some countries, infants, that means less than one year of age, also had a very high risk of catching resistant infections. I am skipping the slide in the interest of time, but I’ll be coming to the drug resistance index, which actually is a very important indicator and it was developed by our own organization, by Dr. Ramanan Laxminarayan and it’s a very interesting indicator.
We looked into this, it ranges from zero to 100 and what does it mean? It basically means, if the DRI for the group of pathogens we are looking at, if it’s zero, then AMR is not really a problem, but if it’s 100, it is a serious problem. And this is a very simple metric, it’s an indicator which just tells the aggregate rate of resistance across a wide number of antibiotics and pathogens. So you can see the speedometer here, zero to 100, and anything above 100 is shown in red, it’s an alarm.
From what we saw, you can see on the right-hand side, most of the countries were above 50%, so it’s a cause of concern. How do we say that? Because if you look into the USA, which we have kept over here, it’s very low, it’s just about 18%, but if you look into the other developing countries out of Africa, like Argentina and India, then that’s very high. So yes, generally it’s a like a litmus test, it’s important for the policy makers because they will not understand all the different signs that we talk about, but if you tell them it’s a DRI or 50%, 60%, it strikes a bell, that’s a cause of concern, and we must do something.
We also looked into AMR drivers at the country level and various socio-economic indicators were considered. In general, we saw that when the education or the socio-economic level of that country, the GDP, the physician density, etc. was better, was higher, the DRI was lesser, so you’ll see the slope of this line is falling down. But if the consumption, if you see in the bottom left, if the drug consumption is high, the DDD is high, the DRI also is high. So this was done by Pearson’s correlation analysis and we definitely need to look into improving the AMR prevention scores of each country and improving their socio-economic indices.
So with this, I will actually end the session, but I’ll be happy to take up any questions in the chat box or separately. And thanking everybody who contributed to this, which has already been mentioned by my colleague Edwin. Thank you.
Erta Kalanxhi
Thank you Geeta, this was a very, very interesting presentation and very much anticipated by many who are working in the field, especially in Africa. Given the time, I think we’ll proceed with our last speaker for today, Dr. Yewande Alimi, who is a One Health and AMR coordinator at Africa CDC and has a unique perspective on what this data actually means.
As the previous speakers mentioned, the MAAP project was looking at both AMR and AMU. So antimicrobial use, for the purpose of time, we are unable to go into details of that part of the data, but Yewande is going to present a couple of slides that are going to give a little bit of an insight into antimicrobial use and access in the region. But most importantly, Yewande, thank you very much for joining us today and would you be able to share your perspective with the audience on how these findings can be translated into policy that can help contain AMR in African countries and beyond?
Yewande Alimi
Thank you very much and thanks to the One Health Trust team for putting this together, and to the speakers who have very much done a fantastic job in showcasing some of these findings. But you’d asked me, what does this really mean to us as a continent? What does this really mean for interventions? I’m hoping that I will be able to tie in the findings from this important initiative, and probably unpack areas where we as a continent need to really focus on.
So Edwin and Geeta have done a fantastic job of sort of highlighting what we call “the crisis within the crisis.” We say this because, as you know, the continent experiences several other outbreaks and there are very limited resources. As much as we imagine AMR to be a silent pandemic, I disagree because it’s right there in our faces.
Concerning findings from the GRAM study and just estimating the highest mortality from AMR infection in the world, we took 27.3 deaths per 100,000 attributable to AMR from the continent. Also, we’ve highlighted some very concerning findings such as the fact that 12 African countries are reporting a [DRI] score higher than 25%. This is where we say we need to ring the alarm, it’s not as silent as we think it is.
Most importantly, we thought to highlight also the concerning sort of gaps around access versus excess. In this work that we did, we highlighted that at least 80% of the total drug consumption across all the 14 countries of Access drugs, it’s just one country that is in line with the WHO recommendation. And very nicely, I’d like to show you where we are taking a step back to understand, how do we then find the balance? The issues around access for essential medicines versus the use of excess, which many of us will know as a chemist, prescription, and being able to get your antibiotics or antimicrobial off the counter. In our findings, we highlight that if you look at the Access category, only 2% of the countries really have this on their national essential medicines list, as well as rather concerning findings with the Watch and Reserve antimicrobials as defined by the WHO’s essential medicines list.
But one of the things that is mostly concerning for us is that many of the antibiotics documented in these 14 countries are not under WHO essential medicines. It means that all of the many of the antibiotics that are used are not preferred or recommended antibiotics by the global bodies. Again, a lot of things for us to consider as a continent, and most importantly, it drives how we use data for policy.
Implications for AMR containment strategy, and I think I would not be making this presentation on behalf of myself, but when we launched this data in September 2022, one of the crucial things is we had an interesting, a very insightful, sort of brainstorming session with the 14 member states, and many of the recommendations I will be highlighting have really come from our AU member states, and we hope that many of these will be cascaded across all the African Union member states.
One of the things I start off with is more testing, less talking. It’s rather concerning that Africa as a continent at the moment, across these 14 countries, which we can relatively say is quite reflective of the challenges across the continent, is our current level of using the data from MAAP is really at 1.3% for current testing. Ideally, we need to progressively increase the number of laboratories that can provide AMR data in Africa to at least 50% of the laboratory capacity. It’s also important as we develop and revise our AMR national action plans, we really reflect some of the gaps as identified, such as the quality of data, or the capacity of data in the National Laboratory Strategy Plans.
As you know, on the continent, many healthcare providers are really private laboratories or healthcare facilities. It’s important that we have our national systems, very closely or very aligned with the private laboratories as well as our private health care providers. We as African CDC, as well as other technical partners from the MAAP, are really keen to work with countries to build a specimen referral system that can really support the progressive increase of bacteriology. There are just several initiatives that have already been funded across the continent that we strongly advocate that many more countries sign up to, at the leadership of African Union as well as our member states, start to look at initiatives, continental or regional initiatives, such as EQuAfrica, are to boost quality assurance processes. But most importantly, you’d agree with me that there’s no one-size-fits-all when it comes to AMR. Quite alright, we’re able to estimate on the human health side, but we mustn’t forget that we really need to embrace a One Health approach where we look at AMR, antimicrobial use and consumption in animal health as well as agricultural sectors.
Data for action – as much as we are pleased to really launch these groundbreaking findings, I think one thing that is most critical to Africa CDC is how can we then use these findings to support our AU member state to drive policy, to drive interventions, and to drive domestic financing? As many more countries are going through the process of revising and costing the national AMR action plans, it’s important for them to really reflect on these findings. A lot of gaps have been identified, at least primarily in the laboratory systems, or when you think about the stewardship programs as well as access to antimicrobials. So it’s important that countries really reflect some of these recommendations and gaps in the revision of their NAPs.
As you’ve seen, we have really concerning findings, particularly when it comes to access, more than ever, we really need our member states to work on updating the national essential medicines list. We did a bit of work a while back, I think in 2019, and it was quite concerning that some of the countries had updated as far back as 2010 for the national treatment guidelines. As much as possible, we want countries to have evidence or data that can really drive their interventions or the directions in which they move towards their stewardship programs. There’s a lot of work that needs to be done and we are really glad as the African Union that we have the African Medicines Agency that has been ratified that is going to go into full action.
You will know that we deal with issues around substandard, falsified medicines, but most important access when it comes to being able to purchase antimicrobials that require prescription just off the counter. So there’s several measures that we need to take as a continent to really improve at these methodologies.
Most importantly, an all systems approach as well as leveraging regionalism is what we really strongly advocate. We need to expand and consolidate the number and capacity of AMR surveillance sentinel sites. One of the things Edwin, I really liked, is how to digitize that data, beyond digitizing the data, also thinking about things like unique patient identifiers so that we are able to link laboratory data with clinical data as well as health outcomes. Africa CDC, as well as several other continental partners, have done remarkable work to build regional public health networks and think about laboratories and shared infrastructure. COVID was an eye-opening experience for all of us and now we know it definitely can work. So one of the things that we are really pushing forward is the Regional Integrated Surveillance and Laboratory Network as well as leveraging the Pathogen Genomic Institute initiative that has provided genomic capacity to more than 47 countries, as well as at the Fleming Fund and the SEQAFRICA regional initiative. And we’re also working very closely for a use case to really use the COVID capacity that is already on the continent, and how to use AMR as a use case. We also would like to adapt the list of WHO priority pathogens and to focus on the epidemiology of Africa.
Money does make the world go round and our recommendations for financing are really crucial. Many of the gaps, you would agree with me, that as much as we might be passionate, we might have the evidence, we have data, if the money’s not there, there’s literally nothing that can be done. So with these findings, we really believe that it would give national governments as well as regional and continental governments an idea of how much more investment we need for health in Africa.
We recall that the Abuja declaration admits a certain benchmark, but upon review many countries are not even able to get to that benchmark. So it’s important that countries start to see how to mobilize our domestic financing that can improve some of these gaps that have been identified. As AMR experts one of the key challenges that we experience is our inability to really advocate in terms of numbers to policymakers. But we argue that with findings like this, with granular data, AMR data such as these, countries can start to build an economic case for AMR containment not just at the national level, but also at the regional and continental level.
We mustn’t forget that, again, looking at the lessons from COVID, involving the private sector, the regional economic communities, industry, as well as philanthropic organizations can really take us a long way. As much as money makes the world go round, we must look at low-cost interventions or cost-effective measures that are right in front of us. A few I would like to highlight are really around investment in vaccinations, provisions of clean water, sanitation, and hygiene, as well as water IPC measures.
I know that we definitely have a lot of global partners on the call, but as a continent, I think more than ever, particularly on AMR, we are hoping that during the World Antimicrobial Awareness Week, we will really be able to put a spotlight on the continent, but there really needs to be more global initiatives and investments coming to the continent to really support antimicrobial resistance interventions.
On that note, I just like to say thank you very much to our African Union member states, who have been a part of the MAAP initiative, as well as our technical and strategic partners of the MAAP initiatives. And most importantly, of course, our funders, who have really made this come to light. Over to you to continue the session.
Erta Kalanxhi
Thank you very much, Yewande, these have been some really good presentations and I can see by the questions that our audience is asking that this presentation has been very timely. A lot of you are asking about these presentations and we have shared a brief on the chat. It’s the brief that Africa CDC launched a month or two earlier. So have a look at that brief and keep an eye for these findings, there will be a publication or two coming out soon, I’m sure.
In the meantime, I see that our speakers have answered quite a few questions. For the sake of time, we are not able to answer all of them. But there’s a few left that perhaps we can attempt for the next five minutes. One of them is regarding, and this is open to everyone, but it’s regarding laboratories in this project, leveraging COVID-19 infrastructure in order to facilitate future AMR surveillance efforts, and I just summarized that question to make it quicker.
Do any of the speakers have any comments on this? Is that going on? I’m assuming it must be. Have these labs increased in their capacity for AMR surveillance following the COVID-19 pandemic response? Well, it’s difficult to answer because we haven’t gone back to the labs after the project but Geeta, you were about to comment on that?
Geetanjali Kapoor
I think what I can just add is that, overall the quality management systems, what was used for building up the COVID labs at least, the basic principles remain the same. So that part can be leveraged onto the bacteriology labs also, and to ensure that there is a reagent supply 24/7, the equipment, everything is running well, there is capacity of the staff, they are trained well. So the basic principles which we have in the LQMS, Lab Quality Management Systems, which was applied for COVID labs. It was always there, it’s nothing new, but we realized that things can happen very fast if there is willpower and if there is leadership. So this part can definitely help us in the long run.
Erta Kalanxhi
So there’s a question about affordability saying, “I agree that enhancing lab capacity is key, but how do we make it affordable, especially in the animal health sector? I wonder if the question is affordable to people or affordable to the countries to upgrade the facilities.”
Geetanjali Kapoor
Again, if we talk of affordability in testing, it may be difficult of course to suddenly expand in every nook and corner of the country. But there are systems, like you can send the samples to the reference lab and over there you know, we have high-quality testing. So that kind of system can be worked out and those labs can mentor the smaller labs.
Various approaches can be adapted while there is more budget to full-fledgedly improve and expand labs at a complete, comprehensive level. There can be middle parts which can be worked up and of course if the policymakers are there with the professionals and there is good teamwork and there is an understanding, they know that when you invest in such things, it really helps in the overall burden and overall expenses, it’s so cost effective in the long run. So I think that idea has to percolate amongst the policymakers also for greater funding. I’m not sure if this typically answers the question but yes, I think it hits it somewhere.
Erta Kalanxhi
And Geeta I believe one more question. Is there a list of priority pathogens from Africa, specific to Africa? Is there a list currently available?
Geetanjali Kapoor
No, I don’t think so. Yewande or Edwin, you can maybe add on over here.
Yewande Alimi
Yeah, I was gonna jump in to say, at the moment, of course, we are very much aligned with the WHO priority pathogen list, and one of the crucial things this work has really done is identifying the fact that many countries are not testing for some of the pathogens on that list. So I think the future of the continent is really where we are able to sort of estimate all the burdens, the trends of various pathogens based on context. As you know, the continent is quite diverse across the 55 member states. This will then give us an opportunity to be able to document it. But at the moment of course, the continent is very much aligned with the WHO priority pathogen list.
Erta Kalanxhi
Thank you very much. With this, I’d like to thank everybody for joining us today. Thank you everybody for sticking around and I see a great number of people still listening to the end of this webinar.
Thank you very much to our speakers who really had to manage their time in a very busy time of the year, especially for those working the AMR field with the AMR Awareness Week coming up, and so many other projects. So, thank you again, if you’d like to revisit the recording of this webinar, you can find it later in a few days on our website at onehealthtrust.org.
So, thank you everybody, and have a great day.
Credits
Invited Speakers
Dr. Yewande Alimi (Africa Centers for Disease Control and Prevention)
Dr. Geetanjali Kapoor (One Health Trust)
Edwin Shumba, MSc (African Society for Laboratory Medicine)
Moderated by:
Dr. Erta Kalanxhi (One Health Trust)